Two SaaS companies can both grow 40% this year and be in very different shape. One gets there with customers who spend more every quarter, so new sales are a bonus. The other loses a slice of its existing revenue every month and has to sell its way back to even before it can grow at all. Net revenue retention is the number that tells those two companies apart, which is why investors ask for it and why it ends up on board slides.
It is also one of the easier numbers to get wrong without noticing. This piece covers what NRR measures, how to calculate it with a worked example, the edge cases that throw it off, and why the published benchmarks you'd compare it against disagree by about twenty points.
What is net revenue retention?
Net revenue retention is the share of recurring revenue you keep from the customers you already had, after their upgrades, downgrades and cancellations. Above 100% means your existing customers are worth more than they were at the start of the period. Below 100% means they are worth less.
The important word is already. NRR follows one fixed group: everyone who was a paying customer at the start of the period. A customer who signs up during the period does not count, however large the deal. That restriction is what makes the number useful. It answers a question new sales can't cover up: are the customers we have growing or shrinking?
How do you calculate NRR?
Take the recurring revenue from your existing customers at the start of the period. Add what those same customers expanded by, subtract what they contracted by and what cancelled, and divide by the starting figure.
NRR = (Starting MRR + Expansion − Contraction − Churn) ÷ Starting MRR
Here is one month at a company with $50,000 of MRR on the first of the month:
| What happened during the month | MRR change | In NRR? |
|---|---|---|
| 9 customers upgraded plans or added seats | +$2,400 | Yes |
| 3 customers moved to a smaller plan | −$600 | Yes |
| 4 customers cancelled | −$1,300 | Yes |
| 6 new customers signed up | +$3,000 | No, they weren't customers on the 1st |
| 1 customer who left in the spring came back | +$500 | No, they weren't customers on the 1st |
NRR = ($50,000 + $2,400 − $600 − $1,300) ÷ $50,000 = 101.0%
Total MRR grew from $50,000 to $54,000 that month, an 8% jump. Only one point of it came from the existing base. The other seven came from new and returning customers, and NRR is the number that separates the two.
What's the difference between NRR and GRR?
Gross revenue retention uses the same starting group but leaves expansion out. It only measures what you lost. In the example above, GRR = ($50,000 − $600 − $1,300) ÷ $50,000 = 96.2%.
The two numbers answer different questions. GRR asks how leaky the bucket is. NRR asks whether growth inside the bucket outruns the leak. A company with 96% GRR and 101% NRR is losing customers at a steady rate and making it up with upgrades from the ones who stay, which is a different problem from one with 99% GRR and 99% NRR, where hardly anyone leaves and hardly anyone grows. Reporting both stops one of them from hiding the other.
Is a monthly NRR the same as an annual NRR?
No, and mixing them up is the most common way to misread the number. Most published benchmarks are annual: the starting group is measured a year later. A monthly figure has to compound before it is comparable.
If every month looked like the example above, 101% a month works out to roughly 113% over a year (1.01 multiplied by itself twelve times). Run the other direction and a 99% month, which sounds almost perfect, compounds to about 89% a year. A one-point miss per month is an eleven-point miss annually.
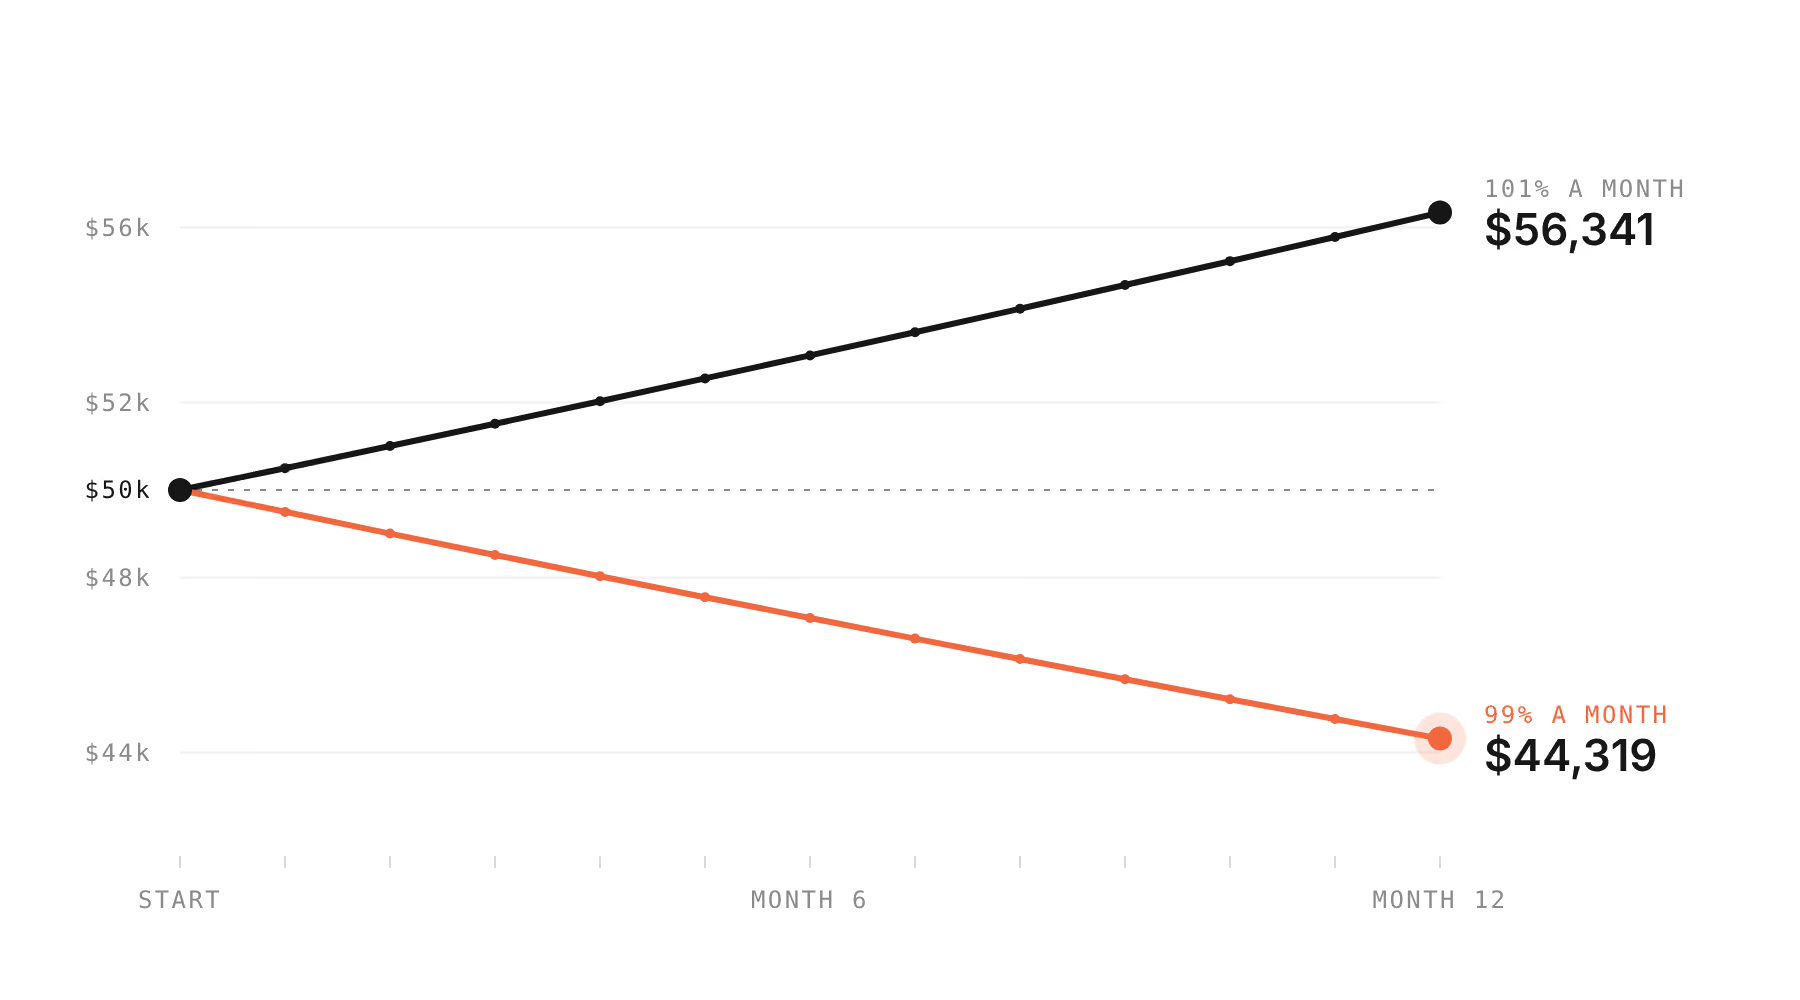
Real months don't repeat exactly, so treat the compounded figure as a sanity check. It still shows why a monthly 99% next to an annual benchmark of 101% compares two different things.
What throws the calculation off?
Most surprising NRR numbers come from the inputs rather than from customer behavior.
Billed amounts standing in for subscription changes. A customer moves from a $200 plan to a $300 plan halfway through a 30-day month. The prorated invoice for the rest of the month is $50. The subscription went up by $100. If expansion is read from invoices, this customer shows $50 of expansion, and in a quarter with a lot of mid-month changes the gap is large enough to move the ratio. Expansion should come from the change in the subscription.
Duplicate records inflating the starting figure. One SaaS company we worked with found that its revenue rollups in Salesforce were inflated by duplicate subscription line records syncing in from billing. Nobody made up a number; two systems disagreed about how many lines a subscription had, and the rollup added all of them. An inflated starting MRR makes NRR look worse than it is, and the team can spend a quarter chasing a retention problem that doesn't exist.
Returning customers counted as expansion. A customer who cancelled in March and came back in August is reactivation. They weren't in the starting group, so they don't belong in the numerator. Counting them as expansion flatters NRR in a way that won't repeat.
Consolidations that look like churn. One ChargeOver customer moved two accounts onto one and added a brand to it. On paper that is one cancellation and one large expansion in the same month. Net, the customer spends more. Whether your report shows that as churn plus expansion or as a single net change is a definition choice, and it's worth deciding before the board asks why churn spiked.
What is a good NRR for a B2B SaaS company?
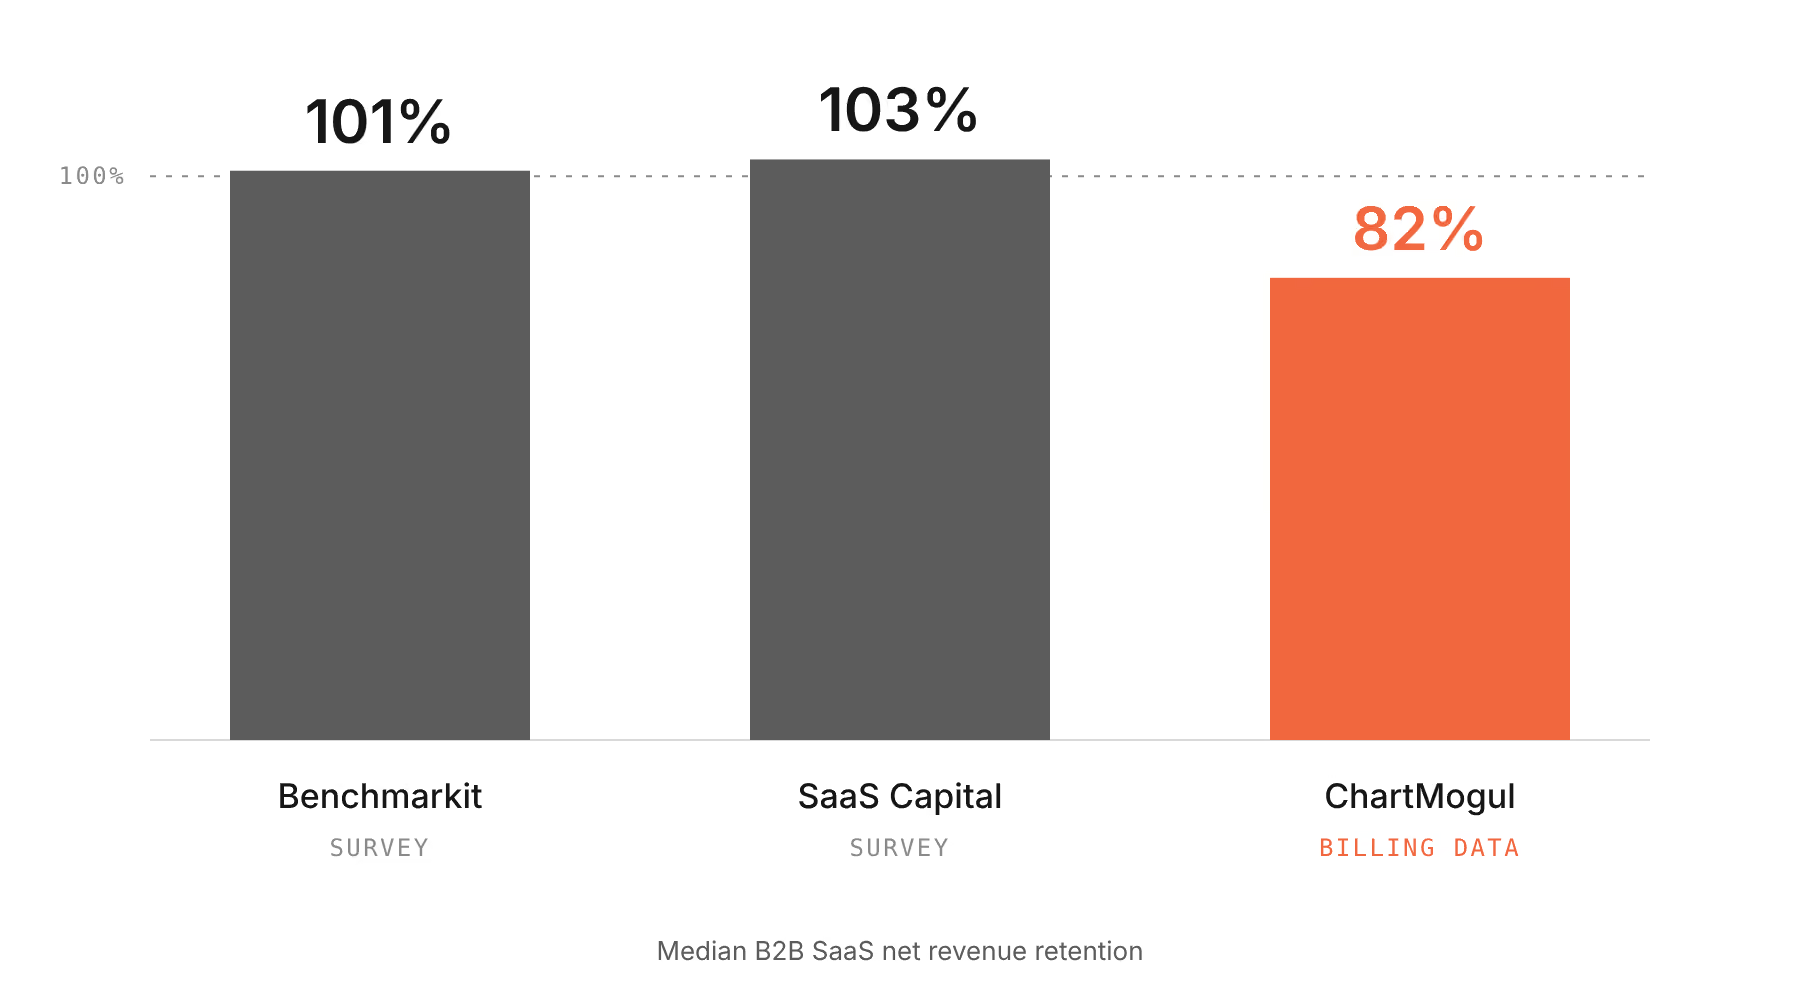
It depends on which benchmark you trust, and the main ones disagree by about twenty points.
Survey-based studies of private B2B SaaS cluster just above 100%. Benchmarkit's 2025 report puts median NRR at 101% and median GRR at 88% (Benchmarkit). SaaS Capital's 2026 benchmark for bootstrapped companies between $3M and $20M ARR puts NRR at 103% and GRR at 91%, from a survey of more than a thousand private B2B SaaS companies (SaaS Capital).
ChartMogul, which measures billing data from roughly 3,500 software companies rather than asking them, puts median B2B SaaS NRR at 82% (ChartMogul).
Why the benchmarks disagree
All three are real measurements of different populations. Companies with 60% retention rarely fill in benchmark surveys, so survey results lean toward businesses that feel good about their numbers. Survey respondents also skew toward larger, higher-priced products, while billing-data samples pull in a long tail of low-priced self-serve products where retention is structurally lower. ChartMogul's 2023 data showed that only 2.7% of businesses with average revenue under $10 per account per month reached NRR above 100%, against 41.1% of those above $500 (ChartMogul, 2023 report).
Definitions differ too. Benchmarkit measures a beginning-of-period cohort a year later and counts downgrades in GRR. Some publishers annualize a monthly figure instead, which reads higher.
So before you compare, check two things: whether the benchmark is annual or monthly, and whether its companies charge what you charge. A $40-a-month product belongs next to the billing-data median. A $2,000-a-month product belongs next to the surveys.
Write the definition down before you report it
Most arguments about NRR are arguments about the definition between people who each think theirs is the obvious one. Settle it on one page: what counts as recurring revenue, whether setup fees and one-time charges are in, how annual prepayments are spread, how a returning customer is treated, how a consolidation is treated, and which system wins when two disagree. Then pull the same month twice, a week apart. If the answers differ, fix that before comparing yourself to anyone.
How ChargeOver reports NRR
ChargeOver calculates NRR from the subscriptions themselves, with the formula above. The MRR Summary report in the Report Center, under Subscriptions & MRR, breaks each of the last 13 months into new, expansion, reactivation, contraction and churn MRR, and shows NRR for each month (help doc). New and reactivated revenue appear in the breakdown but stay out of NRR, for the reasons in the worked example. The NRR Cohort and MRR Cohort reports group customers by when they started, so you can see whether this year's customers are holding up better or worse than last year's.
If you use ChargeOver, open the MRR Summary report and find the NRR row, then open the NRR Cohort report next to it. Support can walk you through how each line is calculated if you're matching it to a spreadsheet you already keep.
If you don't, and this number gets rebuilt in a spreadsheet at the end of every month, take a look at how ChargeOver's reporting works. Either way, the definition work above is worth doing first. No billing system can decide for you what counts.
Transform Your Billing Experience
Your results are just the beginning. Learn how to optimize your billing and scale your success.
FAQ
Does new customer revenue count in NRR?
No. NRR only includes customers who were paying at the start of the period. New customers show up in total MRR growth, not in retention.
Can NRR be above 100%?
Yes. NRR above 100% means expansion from existing customers was larger than what they downgraded or cancelled, so the existing base grew on its own.
Is NRR the same as net dollar retention (NDR)?
Yes. Net dollar retention is another name for the same calculation.
Should I report NRR monthly or annually?
Track it monthly to catch problems early, and report the annual cohort when you compare yourself to a benchmark. A monthly figure has to be compounded before it lines up with an annual one.